
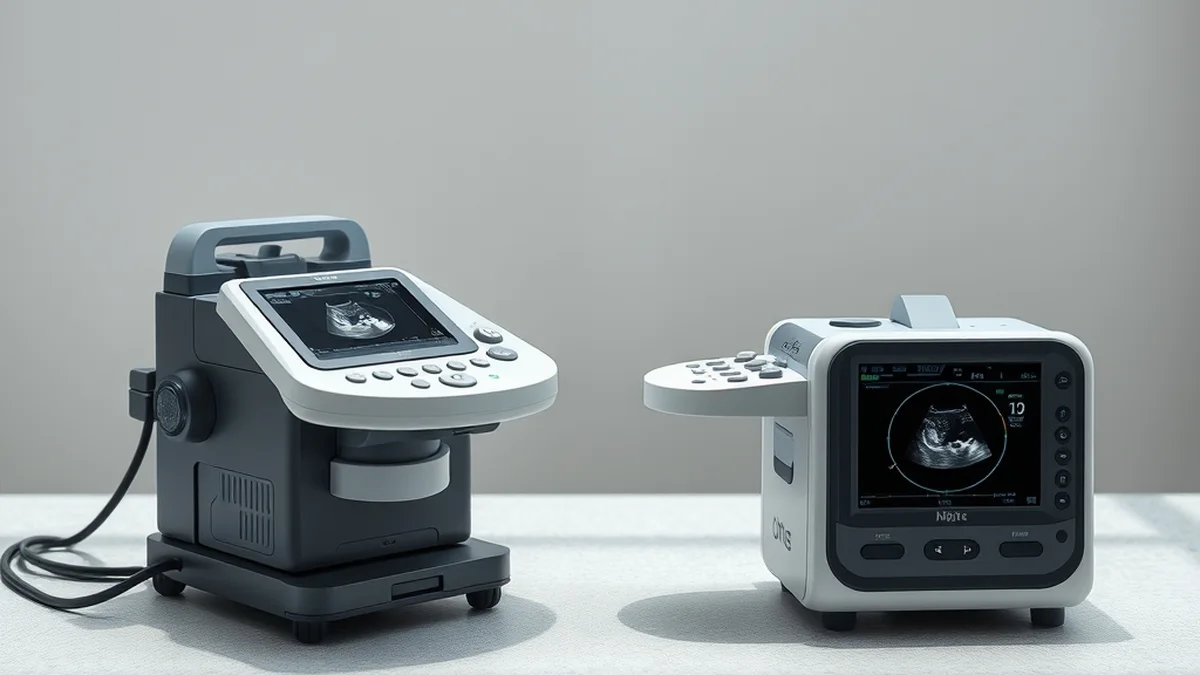
Carotid Intima-Media Thickness Ultrasound Scans vs Framingham Risk Scoring
Carotid Intima-Media Thickness (CIMT) ultrasound scans and Framingham Risk Scoring (FRS) serve as critical tools in assessing cardiovascular risk. CIMT measures the thickness of the carotid artery walls, reflecting atherosclerosis, while FRS estimates the 10-year cardiovascular risk based on traditional risk factors. Both approaches yield valuable insights, yet their mechanisms and clinical implications differ significantly.
Endothelial and Metabolic Mechanisms of CIMT and FRS
The endothelial function is pivotal in cardiovascular health, as it regulates vascular tone and maintains homeostasis. CIMT ultrasound scans assess the intima-media thickness of the carotid arteries, which can indicate early atherosclerotic changes. A CIMT measurement exceeding 0.9 mm is often considered abnormal, suggesting increased cardiovascular risk. This thickening is primarily driven by endothelial dysfunction, characterized by reduced nitric oxide availability, increased oxidative stress, and inflammation. These factors contribute to the progression of atherosclerosis and can be influenced by metabolic syndrome, diabetes, and hypertension.
Conversely, the Framingham Risk Score employs a multifactorial approach, incorporating age, sex, cholesterol levels, blood pressure, smoking status, and diabetes to predict cardiovascular events. For example, a 55-year-old male smoker with a total cholesterol level of 240 mg/dL and systolic blood pressure of 140 mmHg might score significantly higher on the FRS, indicating a greater risk of heart disease. The FRS is grounded in population data and provides a risk percentage, which can guide preventive strategies. However, it may overlook subclinical atherosclerosis detectable by CIMT, particularly in younger populations or those with atypical risk profiles.
Clinical Trial Outcomes: Efficacy of CIMT vs. FRS
Numerous studies have evaluated the predictive value of CIMT and FRS in various populations. A meta-analysis involving over 10,000 participants demonstrated that CIMT is a strong independent predictor of cardiovascular events, with a hazard ratio of 1.5 for each 0.1 mm increase in thickness. This suggests that even small increases in CIMT can significantly elevate cardiovascular risk, making it a sensitive marker for early intervention.
In contrast, the Framingham Risk Score has been validated in diverse cohorts, showing a moderate correlation with actual cardiovascular events. For instance, a study found that individuals classified as high-risk by FRS had a 10-year event rate of approximately 20%, while those categorized as low-risk had a rate of about 5%. However, the FRS may underestimate risk in certain populations, such as women or ethnic minorities, where traditional risk factors may not fully capture the complexity of cardiovascular disease.
Protocol and Threshold Comparison: CIMT vs. FRS
| Parameter | CIMT | Framingham Risk Score |
|---|---|---|
| Measurement Method | Ultrasound imaging of carotid arteries | Risk factor assessment |
| Normal Range | <0.9 mm | 0-9% risk |
| Abnormal Threshold | ≥0.9 mm | ≥20% risk |
| Predictive Value | High for cardiovascular events | Moderate correlation with events |
| Population Applicability | Useful in asymptomatic individuals | Broad population applicability |
This table illustrates the distinct methodologies and thresholds associated with CIMT and FRS. While CIMT provides a direct measurement of vascular health, FRS offers a broader risk assessment based on lifestyle and biological factors. Clinicians may choose to use both tools in tandem for a comprehensive risk evaluation.
Pharmacological Interactions and Measurement Pitfalls
While CIMT and FRS are valuable tools, clinicians must be aware of potential pitfalls. For CIMT, factors such as age, sex, and race can influence measurements, leading to variability in results. Additionally, certain medications, particularly statins, can affect arterial wall thickness, complicating interpretations. In the case of FRS, reliance on self-reported data may introduce bias, as individuals may underreport smoking or overestimate physical activity levels. Furthermore, the FRS does not account for familial hypercholesterolemia or other genetic predispositions, which can skew risk assessments.
To mitigate these issues, it is essential for healthcare providers to consider the patient’s entire clinical picture, including family history and lifestyle factors, when interpreting both CIMT and FRS results. Regular calibration of ultrasound equipment and standardized measurement protocols can enhance the reliability of CIMT readings.
Related Vanguard Lab Briefings: Explore deeper benchmarks in Psyllium Fiber Dosing: Effective Strategy for Lowering Cholesterol.
Weekly Progression Checklist for Cardiovascular Health
- Monitor blood pressure weekly using a reliable device; consider 5 Top-Rated Blood Pressure Monitors You Can Trust for Accurate Readings.
- Track dietary intake focusing on saturated fats and cholesterol; aim for a daily fiber intake of at least 25 grams.
- Engage in at least 150 minutes of moderate aerobic exercise weekly, adjusting intensity based on heart rate zones.
- Schedule annual CIMT scans for high-risk individuals or those with abnormal FRS results.
- Review and adjust medications with a healthcare provider, particularly if there are changes in weight or lifestyle.
By following this checklist, individuals can actively engage in their cardiovascular health management, utilizing both CIMT and FRS as complementary tools. Regular assessments and lifestyle modifications can significantly impact long-term outcomes.
Aligning aerobic zone thresholds with clinical lipid tracking supports durable cardiovascular resilience.